S&P 500 valuation mirrors dot-com bubble peaks as dividend yield hits historic low
Yahoo Finance analysis shows the CAPE ratio approaching 1999 highs while the index’s dividend yield falls to 1.04%, underscoring stretched valuations.
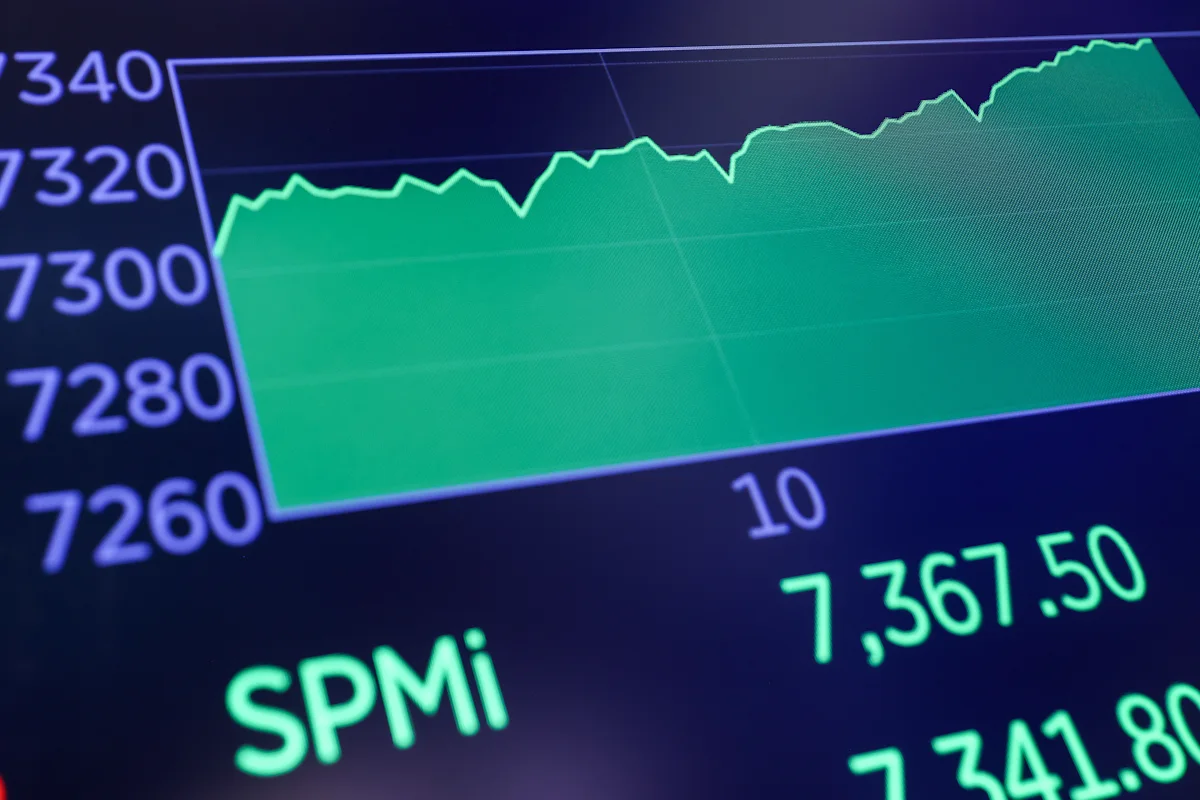
The S&P 500 has reached its second-highest valuation in history, according to data from Yahoo Finance, placing the US benchmark index in valuation territory last seen during the dot-com bubble of the late 1990s. The Shiller P/E Ratio, commonly referred to as the CAPE ratio, currently sits just below the peak recorded in November 1999, when it reached approximately 44.19.
The CAPE ratio measures the price of a stock index relative to its average inflation-adjusted earnings over the previous 10 years. By this metric, the current valuation far surpasses levels seen during the 1929 Crash and indicates a market environment where prices are high relative to historical earnings power. Following the dot-com peak, the ratio eventually fell to 21 by January 2003.
Concurrent with the elevated valuation, the dividend yield on the S&P 500 has dropped to a historic low of 1.04%. This yield measures the total annual dividend income generated by index companies relative to the index's combined market value. The decline in yield coincides with the index pushing to a fresh record high this month, as noted in Yahoo Finance AlphaSpace analysis.
Despite the warning signs presented by these metrics, Yahoo Finance Executive Editor Brian Sozzi advises investors to remain invested rather than attempting to time market tops and bottoms. Sozzi notes that markets can remain overvalued for extended periods, and exiting positions prematurely may cause investors to miss further upside.
The current data highlights a divergence between price levels and income generation, a characteristic often observed during speculative phases. While the CAPE ratio suggests significant overvaluation compared to historical norms, the advice from Yahoo Finance emphasises the difficulty of predicting corrections and the potential cost of market timing.