NASA radar visualises South African crop cycles in new satellite imagery
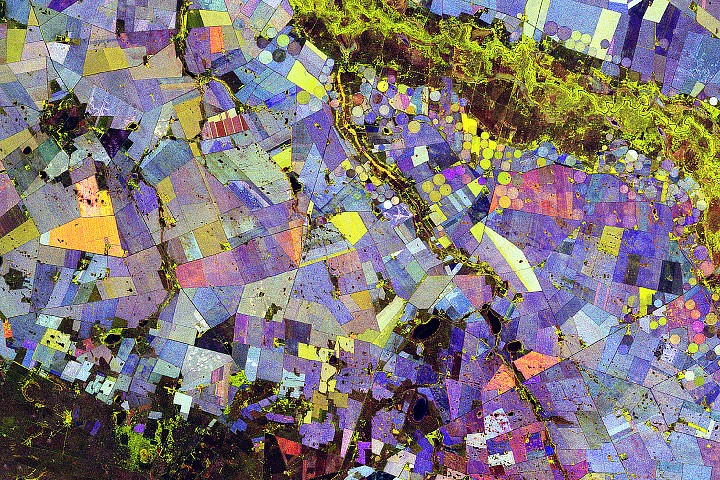
A false-colour composite of the Free State province uses red, green, and blue hues to map vegetation structure, irrigation impacts, and land-use change across the region’s semi-arid agricultural landscape.
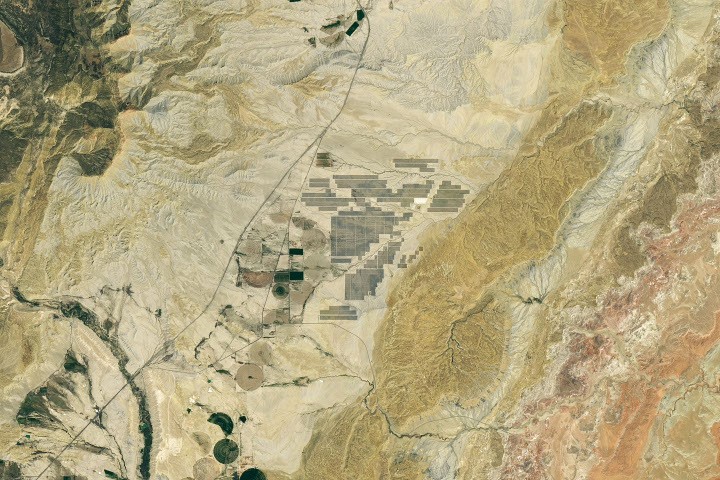
Radar data collected by the NASA-ISRO Synthetic Aperture Radar (NISAR) satellite has produced a detailed visualisation of crop types and seasonal growth changes in South Africa’s Maize Triangle. The imagery, which covers the Southern Hemisphere’s growing season from November 2025 to March 2026, focuses on an agricultural area approximately 110 kilometres north of Bloemfontein along the Vet River.
The visualisation utilises L-band radar observations to analyse vegetation structure rather than surface colour. By combining cross-polarized and co-polarized radar scattering behaviours from ten satellite passes, scientists generated a false-colour composite where red indicates unvegetated surfaces, green represents vegetated areas, and blue hues denote the rate of vegetation change.
Stable vegetation, such as forests, displays a light blue component in the image. In contrast, crops that change structure throughout the season, including wheat and maize, exhibit a darker blue component. Most pixels contain a mix of these colours, creating a varied palette that reflects the complex interplay of different plant types and growth stages across the landscape.
Fields that grow rapidly and are harvested early appear orange due to a combination of green growth and red unvegetated surfaces. Sunflowers are cited as a crop known to exhibit this pattern in the region, although scientists note that ground validation is required to confirm their presence in specific fields.
Paul Siqueira, ecosystems lead of the NISAR science team at the University of Massachusetts Amherst, stated that the technique provides a repeatable method for monitoring crop development, irrigation impacts, and land-use change. As NISAR continues to collect data, researchers aim to compare seasonal patterns, track field-to-field growth differences, and assess how agricultural systems respond to water availability and climate variability.
The visualisation was prepared for NASA Earth Observatory by Michala Garrison using data from the NISAR GCOV product. The accompanying story was written by Kathryn Hansen for NASA Science.