NASA model tracks brown carbon from North American wildfires
An update to the GEOS model allows scientists to distinguish organic aerosols from wildfire smoke, providing clearer data on PM2.5 emissions that worsened conditions in Detroit, Toronto, and other urban centres.
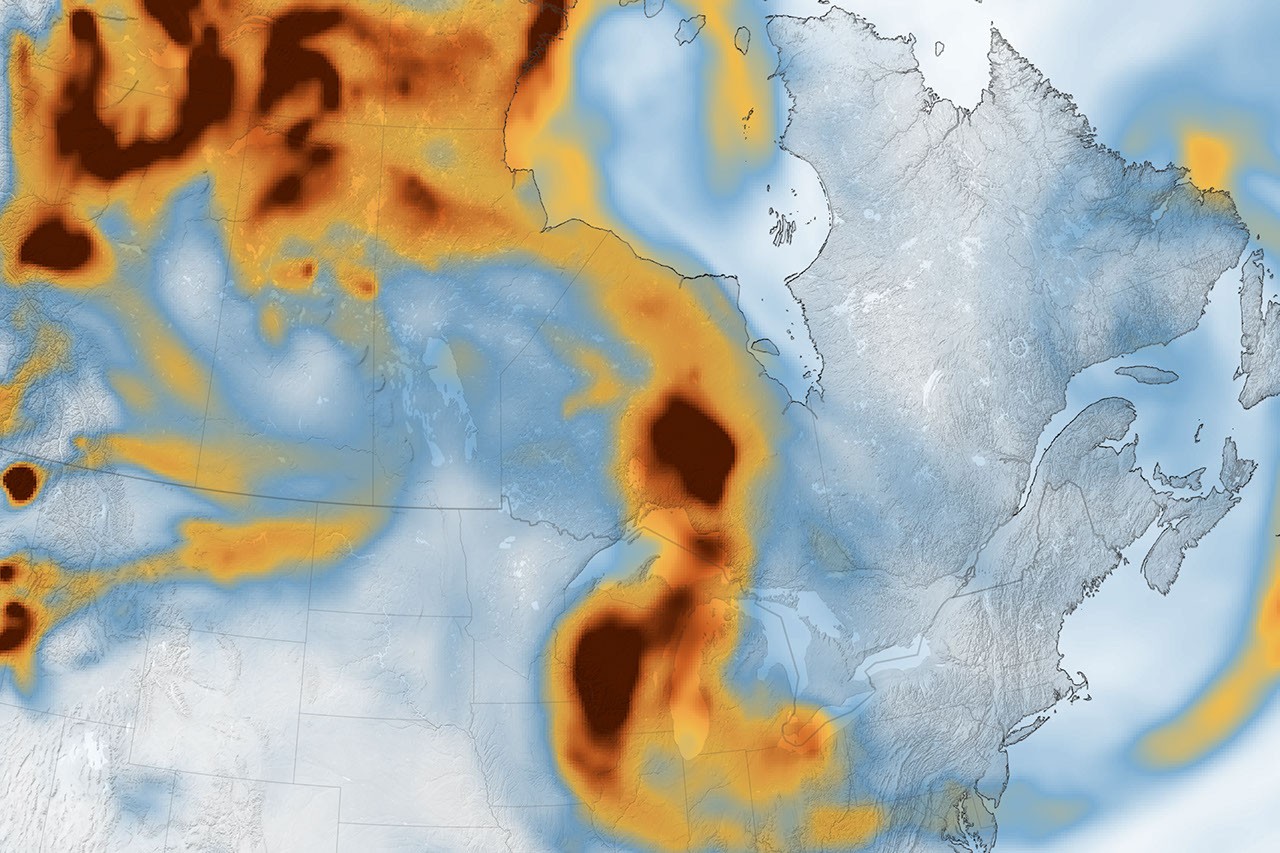
Wildland fires in Canada and the United States released significant quantities of brown carbon and PM2.5 aerosols in July 2026, severely degrading air quality across parts of North America. Smoke plumes originating from Ontario and northern Minnesota drifted southeastward, creating hazardous conditions in major urban centres including Detroit, Toronto, Chicago, New York City, and Washington, D.C., between July 14 and July 20.
Wildland fire activity in Canada typically ramps up in July due to increased lightning ignitions, according to seasonal outlooks by North American fire agencies. The blazes sent smoke plumes pouring across the region, affecting air quality in both countries. The smoke, which gives plumes a characteristic yellow, orange, and brown tint, is a major component of a fire’s PM2.5 emissions, a type of air pollution that can aggravate cardiovascular and respiratory conditions.
Data for the tracking come from a version of the GEOS (Goddard Earth Observing System) model, which assimilates data from satellites, aircraft, and ground-based observing systems. In addition to satellite observations of aerosols and fires, the model incorporates meteorological data such as air temperature, moisture, and winds to project the plume’s behaviour.
On July 14, at the start of the tracking period, numerous fires had already cropped up, including more than 180 in Ontario and several in northern Minnesota. Winds carried the smoke southeast, and by July 15, skies turned hazy and air quality declined from southern Ontario in Canada to the Upper Midwest and Northeast in the U.S.
July 16 and 17 saw air quality in many areas continue to plummet, including in Detroit, where it stayed in the hazardous range for several consecutive days. Toronto, Chicago, New York City, and Washington, D.C., saw air quality ranging from unhealthy to hazardous.
The brown carbon shown in the tracking represents organic carbon that comes specifically from wildfire smoke. Wildfires also emit black carbon, or soot, which contributes to their PM2.5 output. Black carbon has long served as a tracer for smoke plumes, but human sources—such as vehicle exhaust and industrial combustion—produce it too, blending in with the black carbon from fires.
The GEOS model has been able to make that distinction for brown carbon since February 2026, when an update enabled it to split organic carbon into its anthropogenic and biomass-burning components. This capability allowed scientists to isolate the organic aerosols from other sources more accurately.
On July 19 and 20, smoke continued to affect air quality downwind, including in the Great Lakes region, according to the National Weather Service. Storms began clearing it away in parts of the East, where air quality improved to good or moderate. Meanwhile, fires in the Pacific Northwest began degrading air quality there.
The animation and data analysis were produced by Lauren Dauphin using GEOS-FP data from the Global Modeling and Assimilation Office at NASA GSFC, with the story by Kathryn Hansen.